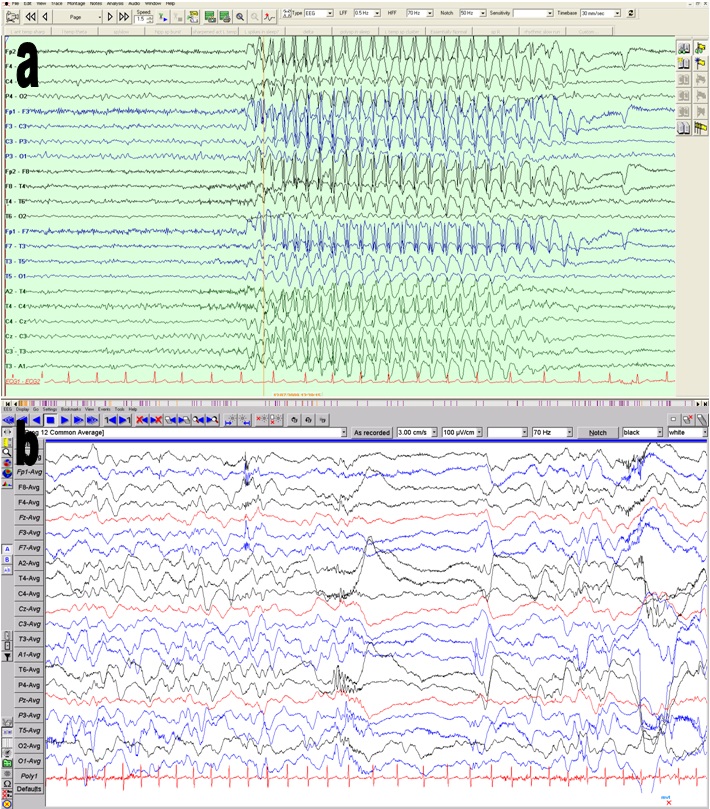
The images below (a & b) show the EEG appearance for two particular groups of seizure.
Have a look at the two of them and note the differences. In the first image, 'a', you can see an area of normal tracing followed by an abnormal pattern. It may help to compare the second image with that normal pattern.
Try to answer the question at the bottom of the page.

